If your company is like most organizations, you’re searching for a
competitive edge. Something that will reduce costs, increase sales,
and make you more agile in a changing business environment.
You’ve found it.
Simply put, 5S is a systematic approach to workplace organization.
But it’s also much more than that. 5S is about efficiency,
competitiveness, and survival. It is a deceptively simple system that
creates an organized and productive workplace.
It’s not just about cleaning up and eliminating toolboxes. 5S creates
a workplace environment that can adapt and succeed.
Chaos and unproductivity are your enemies, organization and
efficiency is your ally.
If implemented correctly and followed diligently, 5S will lead to:
• Lower costs
• Better quality
• Improved safety
• Increased productivity
• Higher employee satisfaction
From the offices of upper management to the workstations in the
factory, the power of this system will quickly reveal itself in your
bottom line.
The Five Pillars
Originally developed by Hiroyuki Hirano for manufacturing
companies in Japan, the principles of 5S translate well to the
laboratory, the repair facility, and even the corporate office. Almost
any work environment will benefit from the structure and efficiency
this model provides.
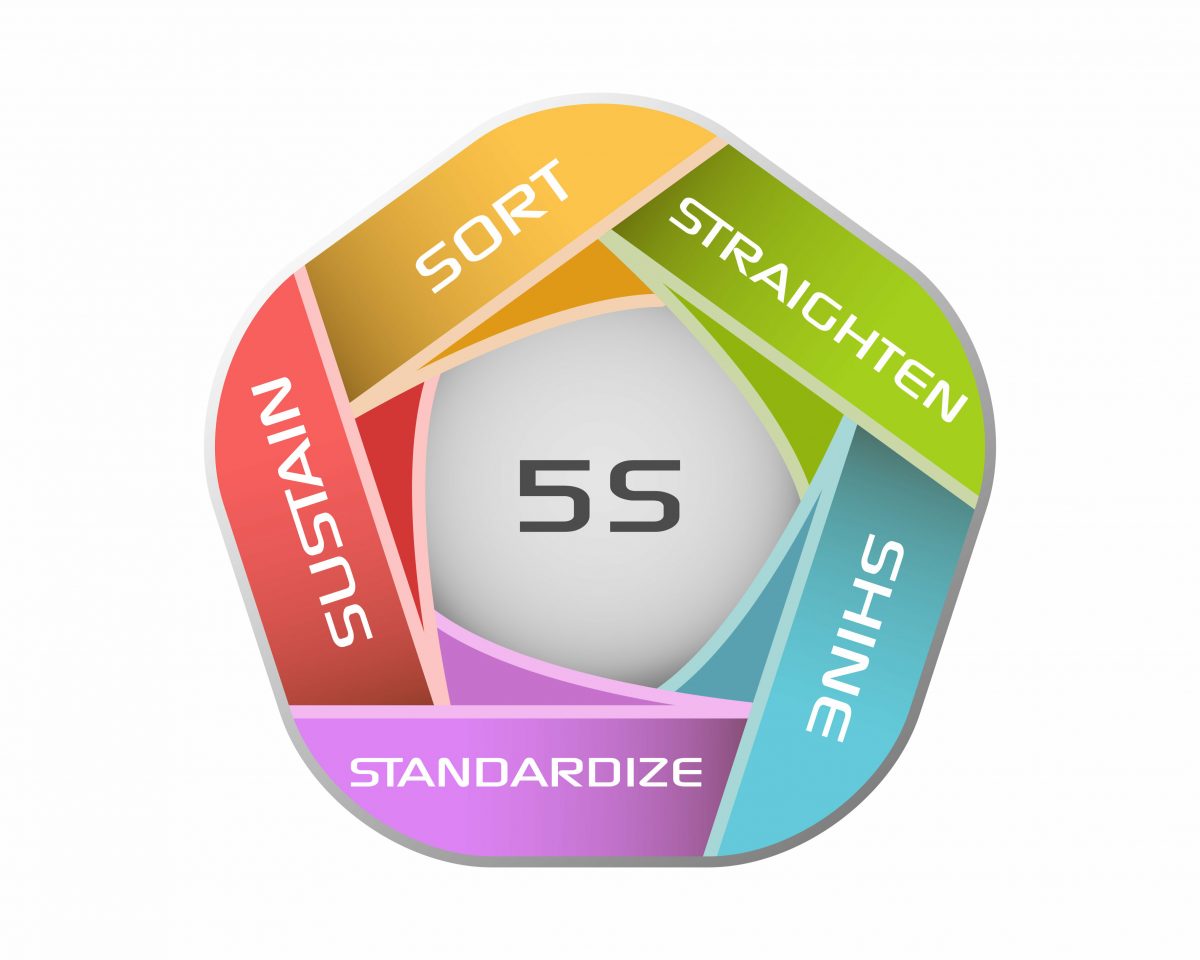
5S is sometimes called the five pillars because just like the physical
pillars that hold up a structure, 5S has five elements that support the
effectiveness of the system.
And just like the pillars of a building, if one was to weaken or fail, the
entire structure would fall.
The five steps/pillars of 5S are:
1 Sort
2 Set in Order
3 Shine
4 Standardize
5 Sustain
For a free 5S learning session for you and your team, why not contact us today, and get started in the elimination of waste in your business.
A way of thinking which will help us and enable us to re-examine much of what we do and how we do it, with the principal focus on adding value for both the customer and our company. This way of thinking is called ‘lean’. Incorporating lean thinking and solutions will help us become more effective and efficient at what we do, increasing customer satisfaction and adding value nationally.
The concept of lean is centred on the elimination of waste. The result is better quality, faster customer response, better efficiencies, lower inventories, and a safer working environment for all. Ultimately, each of these results also contributes to increasing our return on capital.
1. Identify Value.
First we must identify value as defined by the customer, ensuring that we clearly understand what it is that the customer wants. The value we provide our customers is in servicing their needs for products. Our customers expect:
Availability of our products
High-quality, reliable products
Excellent service
Excellent communication
DIFOT
2. Mapping the Value Stream.
Next, we need to identify the value stream. A value stream consists of all the actions (value added & non-value added) currently needed to bring a product or transaction though the necessary steps required for the product or service to be delivered.
The value stream approach ensures that we look at the ‘big picture’, looking to improve the output as a whole rather than locally optimising the parts. Failure to consider the entire flow can result in time and resources spent optimising a specific step but which does not yield more or better output at the end of the process.
Value stream mapping is a simple process where we observe the flow of both information and material in the ‘current state’, creating a flow chart depicting both visually (and usually drawn by hand). After studying the different forms of waste in the current process, we then create a ‘future state’ map which will have improved performance.
Use two basic methods of mapping value streams; swim lane flow charting, and traditional value stream mapping. Swim lane flowcharts are best used when the primary flow is information and decisions passing through various functional groups.
In swim lane analysis, there will be a column (or row) dedicated to each function, showing all activities performed by each group. When the primary flow consists of material (units), we use traditional value stream mapping, which depicts the physical flow of the material at hand, as well as the supporting information flow.
Waste
If the customer would not be willing to pay for something we do, then we should consider it waste, and strive to reduce or eliminate it altogether. Regardless of how much waste we have in our process, the absolute amount of value does not change. The customer will not pay for our waste, so it is up to us to identify and eliminate it. This is a sure path to cost reduction. What is waste? We use two methods to identify waste.
The first method is to classify all activities and materials into one of two categories:
Value-added (VA) Value-added activities are those which somehow change the material, size, shape, form or function of the service product in order to satisfy the customer.
Non Value-added (NVA). Non value-added activities are those that do not change the material, size, shape, form or function of the service product change (NVA activities may require or consume our resources, but are not adding value in the customer’s eyes).
The second methodology is to identify the Eight Forms of Waste, as used by world’s best practice companies.
Eight wastes symptoms of lean manufacturing.
3. Flow and Pull
Once we have clearly identified our processes, we then look at how to make each process ‘flow’ more efficiently and effectively. The objective is to eliminate as much of the waste as possible, leaving only value-added steps in the process. We want our processes to be as capable and predictable as possible, reducing waiting and queuing, and eliminating bottlenecks and reworks. Eliminating waste reduces unnecessary costs and improves our profitability. Instead of processing as much as we can at each step, we want to process only what is needed, when it is needed.
This is called ‘pull’, as the customer is pulling what they need. If it is not possible to process exactly what we need when we need it, we may need to process a small quantity ahead of time in order to place a buffer between our customer and our processes. This will allow the customer to take what they want immediately, while we then work to replenish what was consumed.
A common example of this is a supermarket, where the consumers take what they wish, and the supplier then replenishes exactly what was consumed, during the night, so the supermarket is ready again for the next day. If the supplier were to ‘guess’ what would be consumed and ship the products ahead of time, this would be called a ‘push’ system, and the ‘guess’ would be wrong almost every time.
4. Continuous Improvement
As we continue to remove waste from our processes, the value-added activities become more and more clear. In many of our business administration processes, we may be so used to doing something, we believe it is necessary, and therefore adding value. It is critical that we question everything we do, and look to eliminate waste and make the value-added processes even more efficient than they are today.
We must look at everything we do with an eye for improvement, from our global distribution systems to where we place the photocopier. In identifying opportunities for improvement, we consider every improvement and add it to our list—no matter how small.
PDCA
PDCA is the acronym for to the sequence of continuous improvement actions described as Plan-Do-Check-Act. PDCA is a methodology for implementing changes using a four-step process.
PLAN
Determine the tasks and processes required to deliver the results according to the output expected.
DO
Complete the tasks and implement the new processes. If possible, implement in a small area prior to full implementation as a test. Ensure all involved are properly trained.
CHECK
Measure the results generated by new processes and compare against the expected output to verify. Analyse differences and identify root causes.
ACT
Determine and implement corrective actions to prevent recurrence of the root causes. Standardise on the new process, and repeat the PDCA cycle. Once an improvement has been determined to be successful we then need to establish new standards and ensure appropriate people are trained. These new standards are critical in ensuring that we maintain the gains and do not slip back into old habits.
Metrics – KPIs
Each department or function should have metrics which help to measure performance. These metrics are called key performance indicators, or KPIs. It is especially important that each KPI:
Is identified, clearly posted, and up-to-date
Has a clear owner
Has a review process
Is tracked with undesirable trends addressed
The department controls.
Standard Work
Standard work refers to the methodology of defining the best way to do something, documenting it, and creating a system to ensure that everyone who does the same work does it the same way. Utilising standard work helps us to reduce waste in all areas of our business, driving lower cost, higher margins.
Standards are critical, as they enable us to plan and manage our daily activity and provide a basis for improvement. In order to maximise our success, we need to continually improve our efficiency by standardising on improvements and continuing to build on them.
Efficiency & Productivity
Efficiency is a measure of how well we perform versus our standards. Standards are pre-determined expectations of how much time, work, or material a task should take.
As we remove the inefficiencies and improve our methods, we see efficiency improving. This improvement in efficiency is called productivity. Being able to do “more with less”, results in lower costs and higher profits.
Being able to measure efficiency and productivity gives us the ability to set annual improvement targets, and track our progress accordingly.
5S
‘5S’ is the foundation of lean implementation. It provides the basis for achieving world-class status. 5S is a continuous process of maintaining a clean, well-organised, visual workplace. The 5 S’s are:
Sort Clear out all unnecessary items.
Stabilise Organise all necessary items such that they are clearly marked and easily accessed.
Shine Clean absolutely everything. Identify points to inspect during routine cleaning.
Standardise Make cleaning and organising a part of everyone’s daily activities.
Sustain Maintain the gains, and work to continuously improve. If everything we need is conveniently located in uncluttered work areas, we will all spend less time looking for items or trying to get around unneeded materials or equipment. This will lead to higher workplace efficiency.
5S Benefits
Safer working conditions
Saving of space
Higher productivity
Improved morale and pride
Better quality
A cleaner, brighter and better organised work area
Reduction of waste
Better customer impression
Visual Management
Visual management is a method which enables everyone to understand in real-time:
What are our goals?
What measures are we using?
How are we performing against those goals?
Is something preventing us from reaching our goals?
How do I contribute to achieving our goals?
Visual management helps simplify understanding the status of the workplace and provides a more accurate perception of reality, enabling team members to make informed decisions quickly.
Being able to walk into an office or branch and know the status of activities without having to ask questions is a sign of good visual management. Everybody has the same information at the same time, and the information is clear and understandable.
Visual Management also helps to eliminate having individual, isolated pools of knowledge by converting it into a centralised, visible knowledge centre in which everything is visible and can be easily interpreted.
It is important to ensure the shortest path from the information being known and the information being posted for all to see. Rather than gather data, enter in a computer, print and post, it is much more efficient and effective to simply walk to a board and write the information by hand.
Daily Meeting
Each day should start with a short meeting to ensure everyone has the same information. The meeting should be held in a central location in the office or shop floor and should last only 5 to 7 minutes. The meeting should cover plans, exceptions, and assignments to resolve exceptions only.
The daily meeting should be led by the manager, and attended by a cross-functional team responsible for the goals in each area. In the office the team might include the Branch Manager, sales, procurement, and administration. In the shop the team might include the Supervisor, Team leader, Production Manager, production staff, quality, planning, and administration.
Action items resulting from the daily meetings should be logged and reviewed each meeting.
Problem Solving
Every day we face issues which prevent us from “getting it right the first time”.
Customer complaints, data entry errors, missed tasks, poor quality, missing information and many other issues occur as a result of a breakdown in our processes. In order to satisfy our customers and conduct our work efficiently, we need dependable processes and controlled inputs.
The data we gather to help us solve our problems must be factual and complete. Without fact-based data we cannot make accurate analysis or reach accurate conclusions.
Problem-solving Tools
Typically, it is the person who is directly involved in the activity who has the best knowledge of the activity and the most information. We therefore believe it is best to give our employees the tools and skills necessary to solve our own problems rather than rely on a small pool of experts.
This is a breakdown of the 8 wastes for you to get an understanding. The acronym “wormpits” is an easy one to remember. Check it out below and don’t hesitate to contact us for a free session to assist your team identify these wastes.
Waiting:
Delays for parts assignments?
Delays for lab test results?
Delays to fit staff schedules?
Excessive signatures or approvals required?
Too much dependency on others to complete a task?
Cross-departmental resource commitment issues?
Overproduction:
Ordering more consumables than required for expected build?
Entering repetitive information on item documents?
Repeating the same questions across multiple assessments?
Producing more paperwork than needed?
Ordering more tests or services than what is required by the customer?
Rejects:
Retesting due to inadequate sample, or wrong process earlier?